Unsupervised learning for turbulent structure identification
Research pertaining to the study of coherent structures in turbulent flows has long involved using arbitrary thresholds to elucidate regions of interest. This normally involves modifying the threshold value of a specific flow quantity until the structures relevant to that flow quantity fit perceptual expectations. The process can be thought of as twisting a knob until things look right, which inherently involves some level of subjective decision making.
This approach is suitable for gaining general insights on the flow (i.e visualize vortex clusters to see where the flow is most energetic). Though, in the literature I’ve commonly seen arbitrary values to highlight high/low speed regions via a 10%/-10% velocity threshold. Thresholds for vorticity metrics (such as Q-criterion) normally vary from study to study. This makes detailed analyses of the visualized structures challenging, as one would have to rationalize why the selected threshold value was chosen.
This study addresses the aforementioned issues by using a machine learning framework that automatically organizes flow into clusters in an unsupervised fashion. The boundaries of the identified structures are not bound to a subjective value, instead these boundaries are automatically learned based on computational pattern recognition.
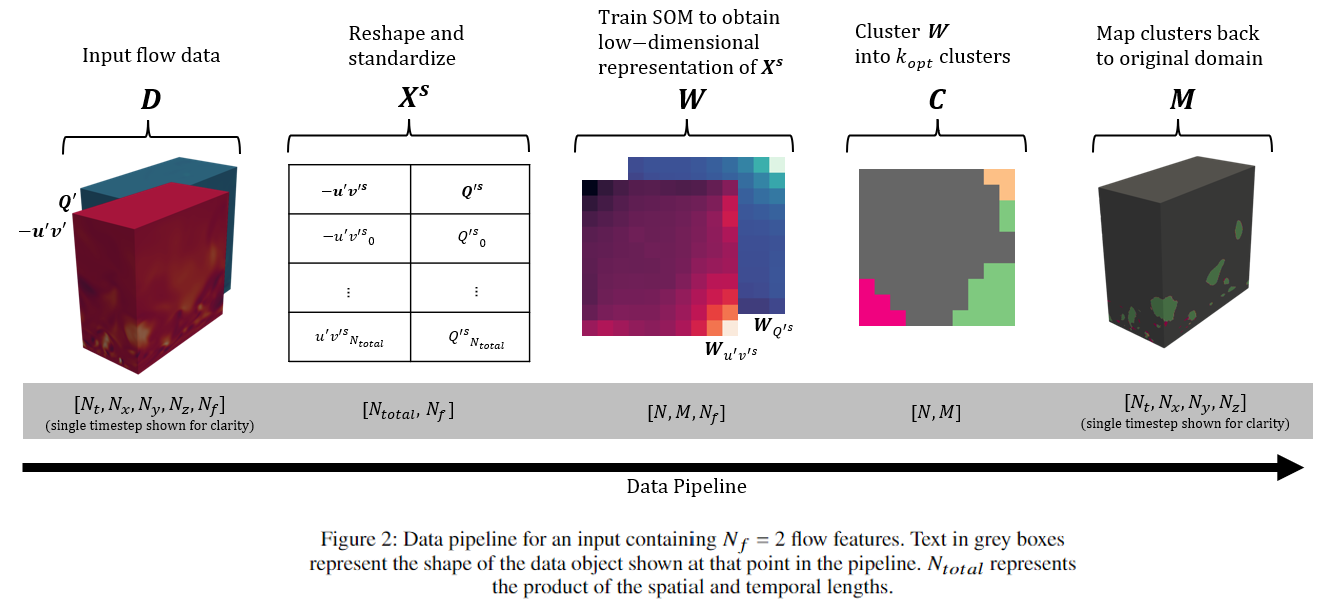
I step away from the more popular deep learning networks, as they are not yet compatible with the highly reolved four dimensional inputs of direct numerical simulations (DNS). Instead, I turn back the clock and use a self organizing map (SOM). The SOM essentially generates a low-dimensional representation of the DNS data, which can be further clustered by an agglomerative clustering algorithm. I use K-means, and employ additional steps to automatically learn the optimal amount of clusters, and ensure output reproducibility (i.e neutralizing stochasticity). The general ML pipeline is shown below.
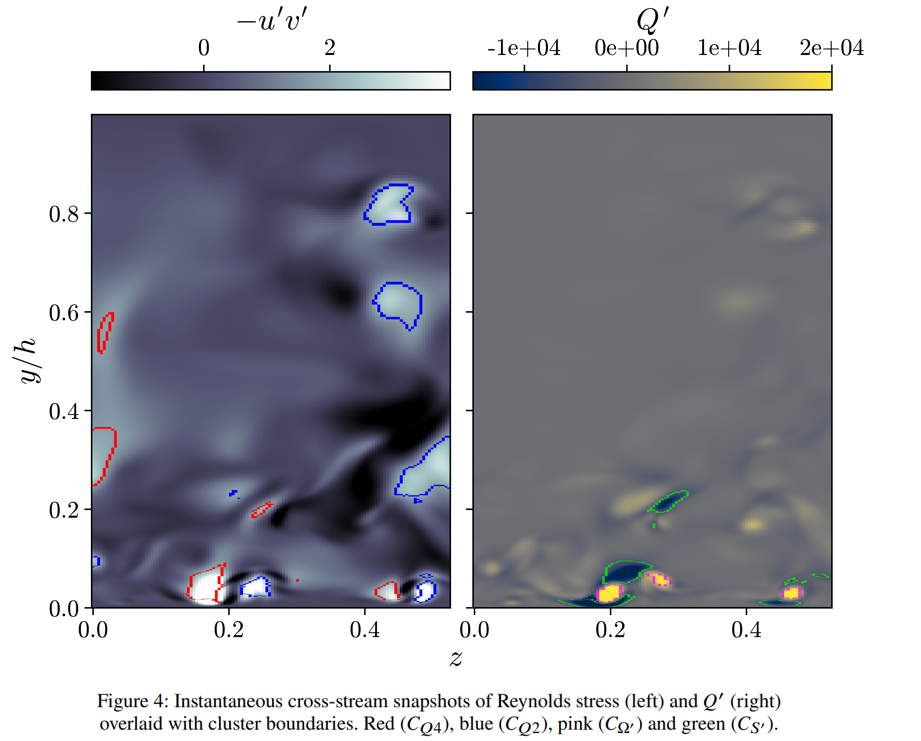
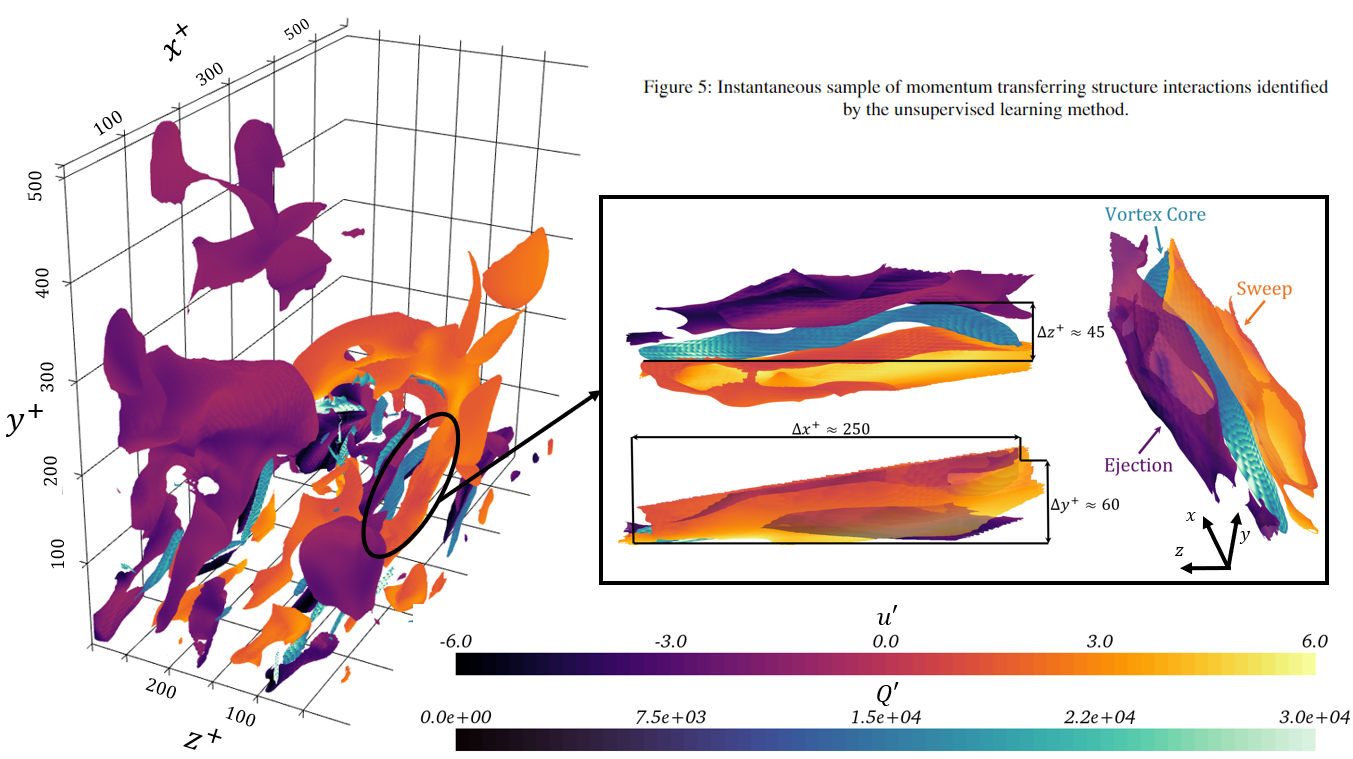
Once trained, clusters contained within the M tensor can be analyzed visually and statistically. I show qualitative figures below to demonstrate the strength of the method, though numerous statistical analyses were done as well.


